Cost Analytics
Cost Analytics shows network-wide AI spend for all enrolled instances — with daily rollups, a month-end forecast, per-model breakdowns, and the top-spending instances and squads.
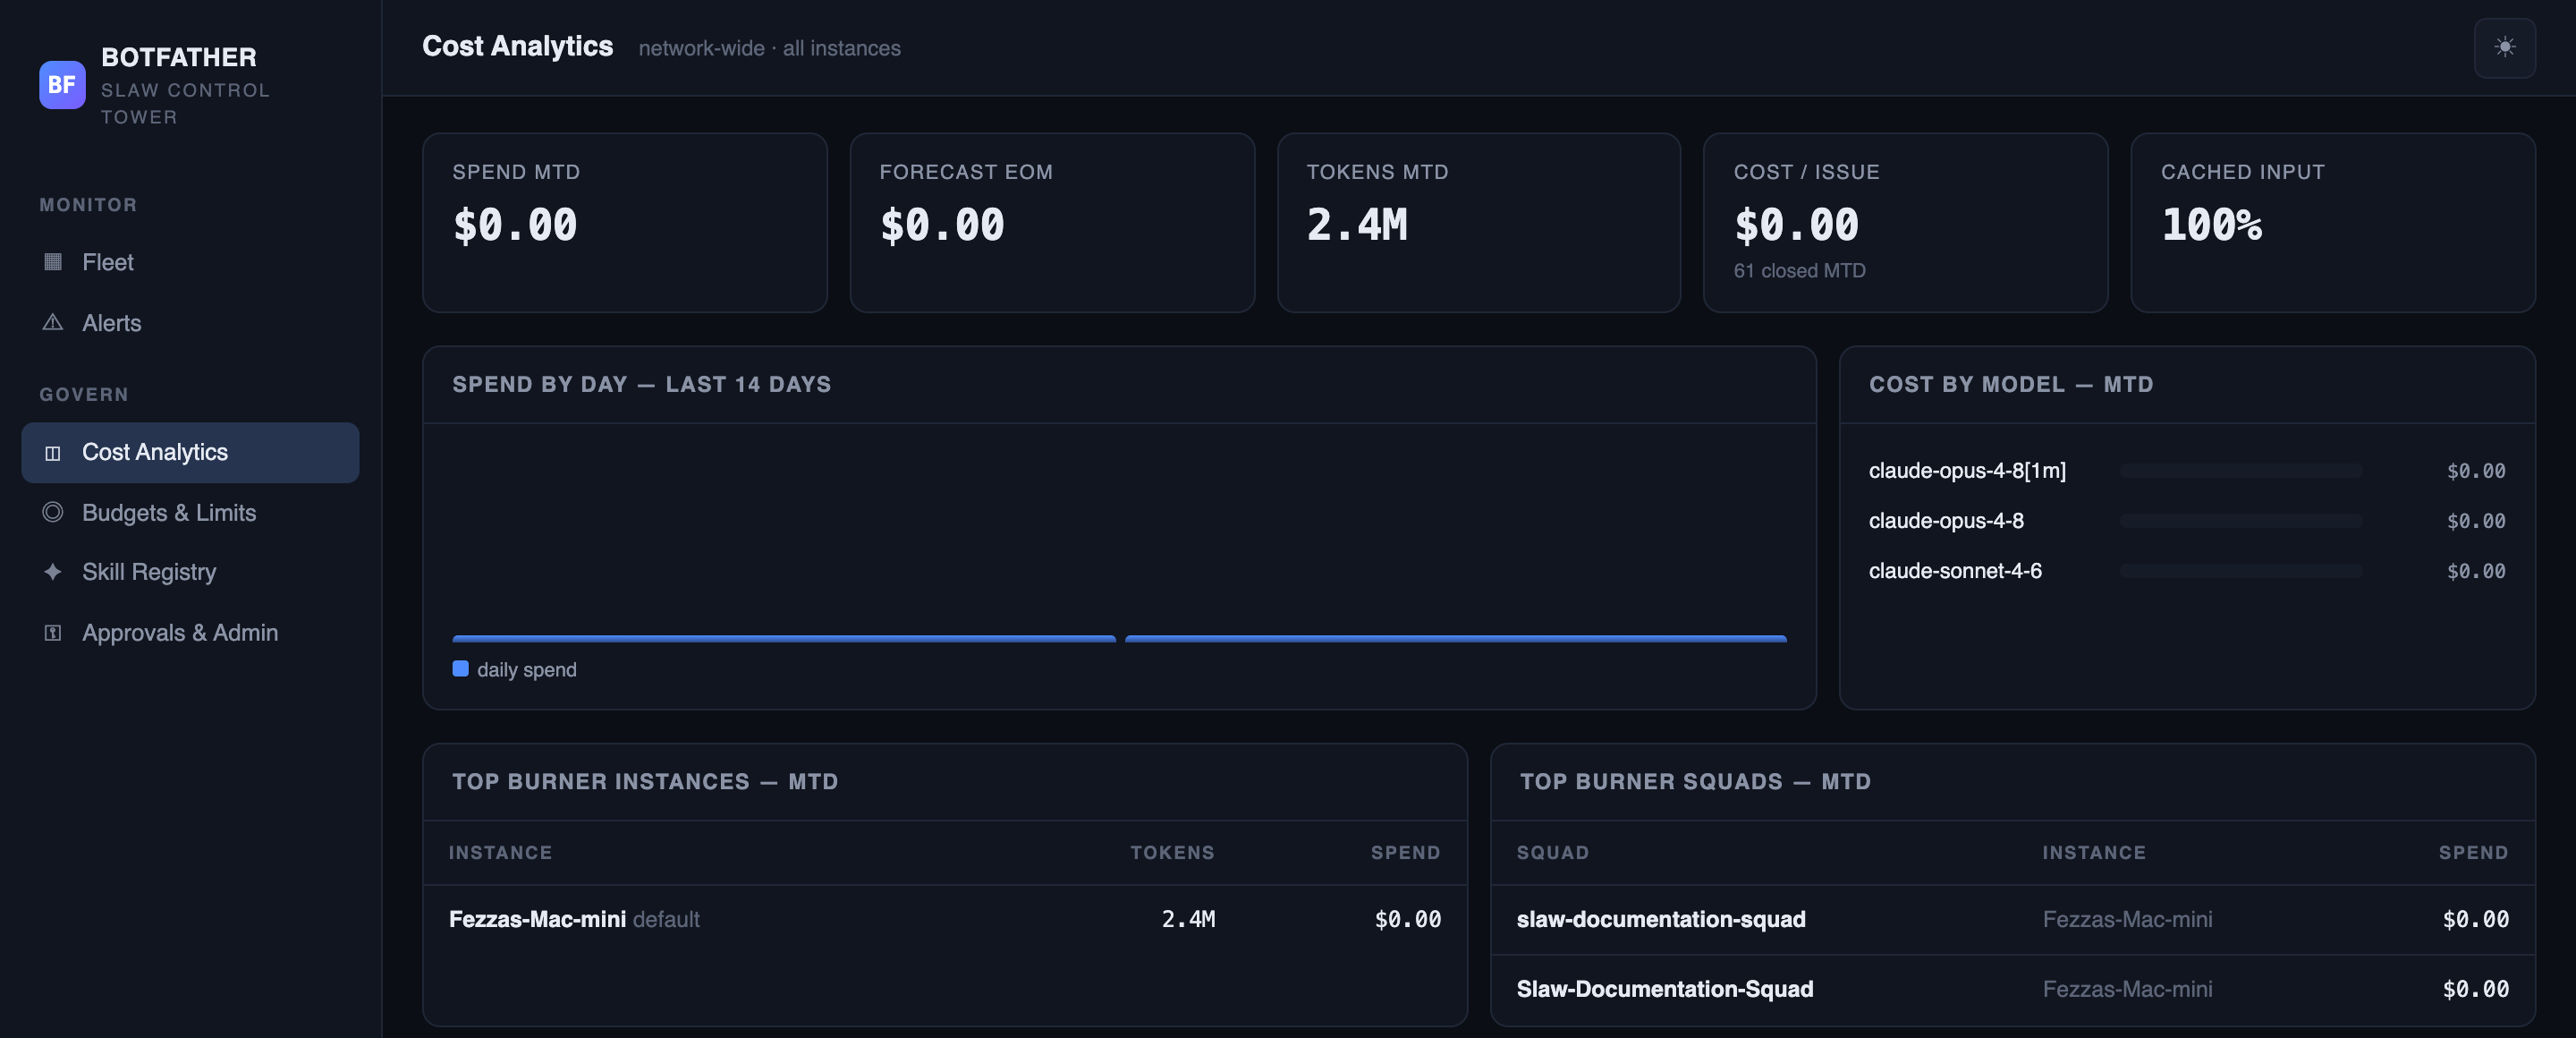
KPI tiles
Five summary tiles cover the whole network. The page refreshes every 30 seconds.
| Tile | What it shows |
|---|---|
| Spend MTD | Total spend across all instances since the start of the calendar month (UTC). |
| Forecast EOM | Linear extrapolation: (MTD spend / day-of-month) × days-in-month. Recalculates each refresh. |
| Tokens MTD | Total input + output tokens consumed across all instances this month. |
| Cost / Issue | Average cost per closed issue MTD: spend_mtd / issues_closed_mtd. Sub-line shows the issue count. |
| Cached Input | Percentage of input tokens served from the model's prompt cache this month. Higher is better. |
Spend by Day chart
A bar chart shows the last 14 days of daily spend aggregated across all instances and squads. Hover a bar to see the exact date and dollar amount. Bars are drawn from rollups_daily, which the tower populates on an hourly schedule.
Cost by Model
A horizontal bar chart shows month-to-date spend broken down by AI model, sorted by spend descending. Use this to identify which models are consuming the most budget.
When an instance reports subscription-plan usage (dollar cost near zero), that instance's token consumption still appears in Tokens MTD and the cached-input percentage — but it contributes zero to the Cost by Model chart.
Top Burner Instances
A table ranks the top-spending instances by month-to-date cost. Click through to Instance Detail to investigate a high-spend instance.
| Column | What it shows |
|---|---|
| Instance | Hostname and instance ID. |
| Tokens | Total input + output tokens MTD for this instance. |
| Spend | Dollar cost MTD. |
Top Burner Squads
A table ranks the top-spending squads across the fleet. A squad entry shows its name, the hostname of the instance it lives on, and its MTD cost.
| Column | What it shows |
|---|---|
| Squad | Squad name (or local ID if not yet synced). |
| Instance | Hostname of the instance this squad runs on. |
| Spend | Dollar cost MTD for this squad. |
How spend is calculated
Spend figures aggregate cost_facts rows, which SLAW instances report in each heartbeat's ingest payload. The tower stores them verbatim — it does not re-calculate token prices. If an instance reports $0 (subscription plan), that is recorded as-is. Hourly rollups materialise daily aggregates into rollups_daily for fast chart queries.
Next steps
- Budgets & Limits — cap spend at the enterprise or per-instance level.
- Alerts — configure spend-spike and budget-breach notifications.
- Instance Detail — drill into a specific instance's cost breakdown.