Dashboard
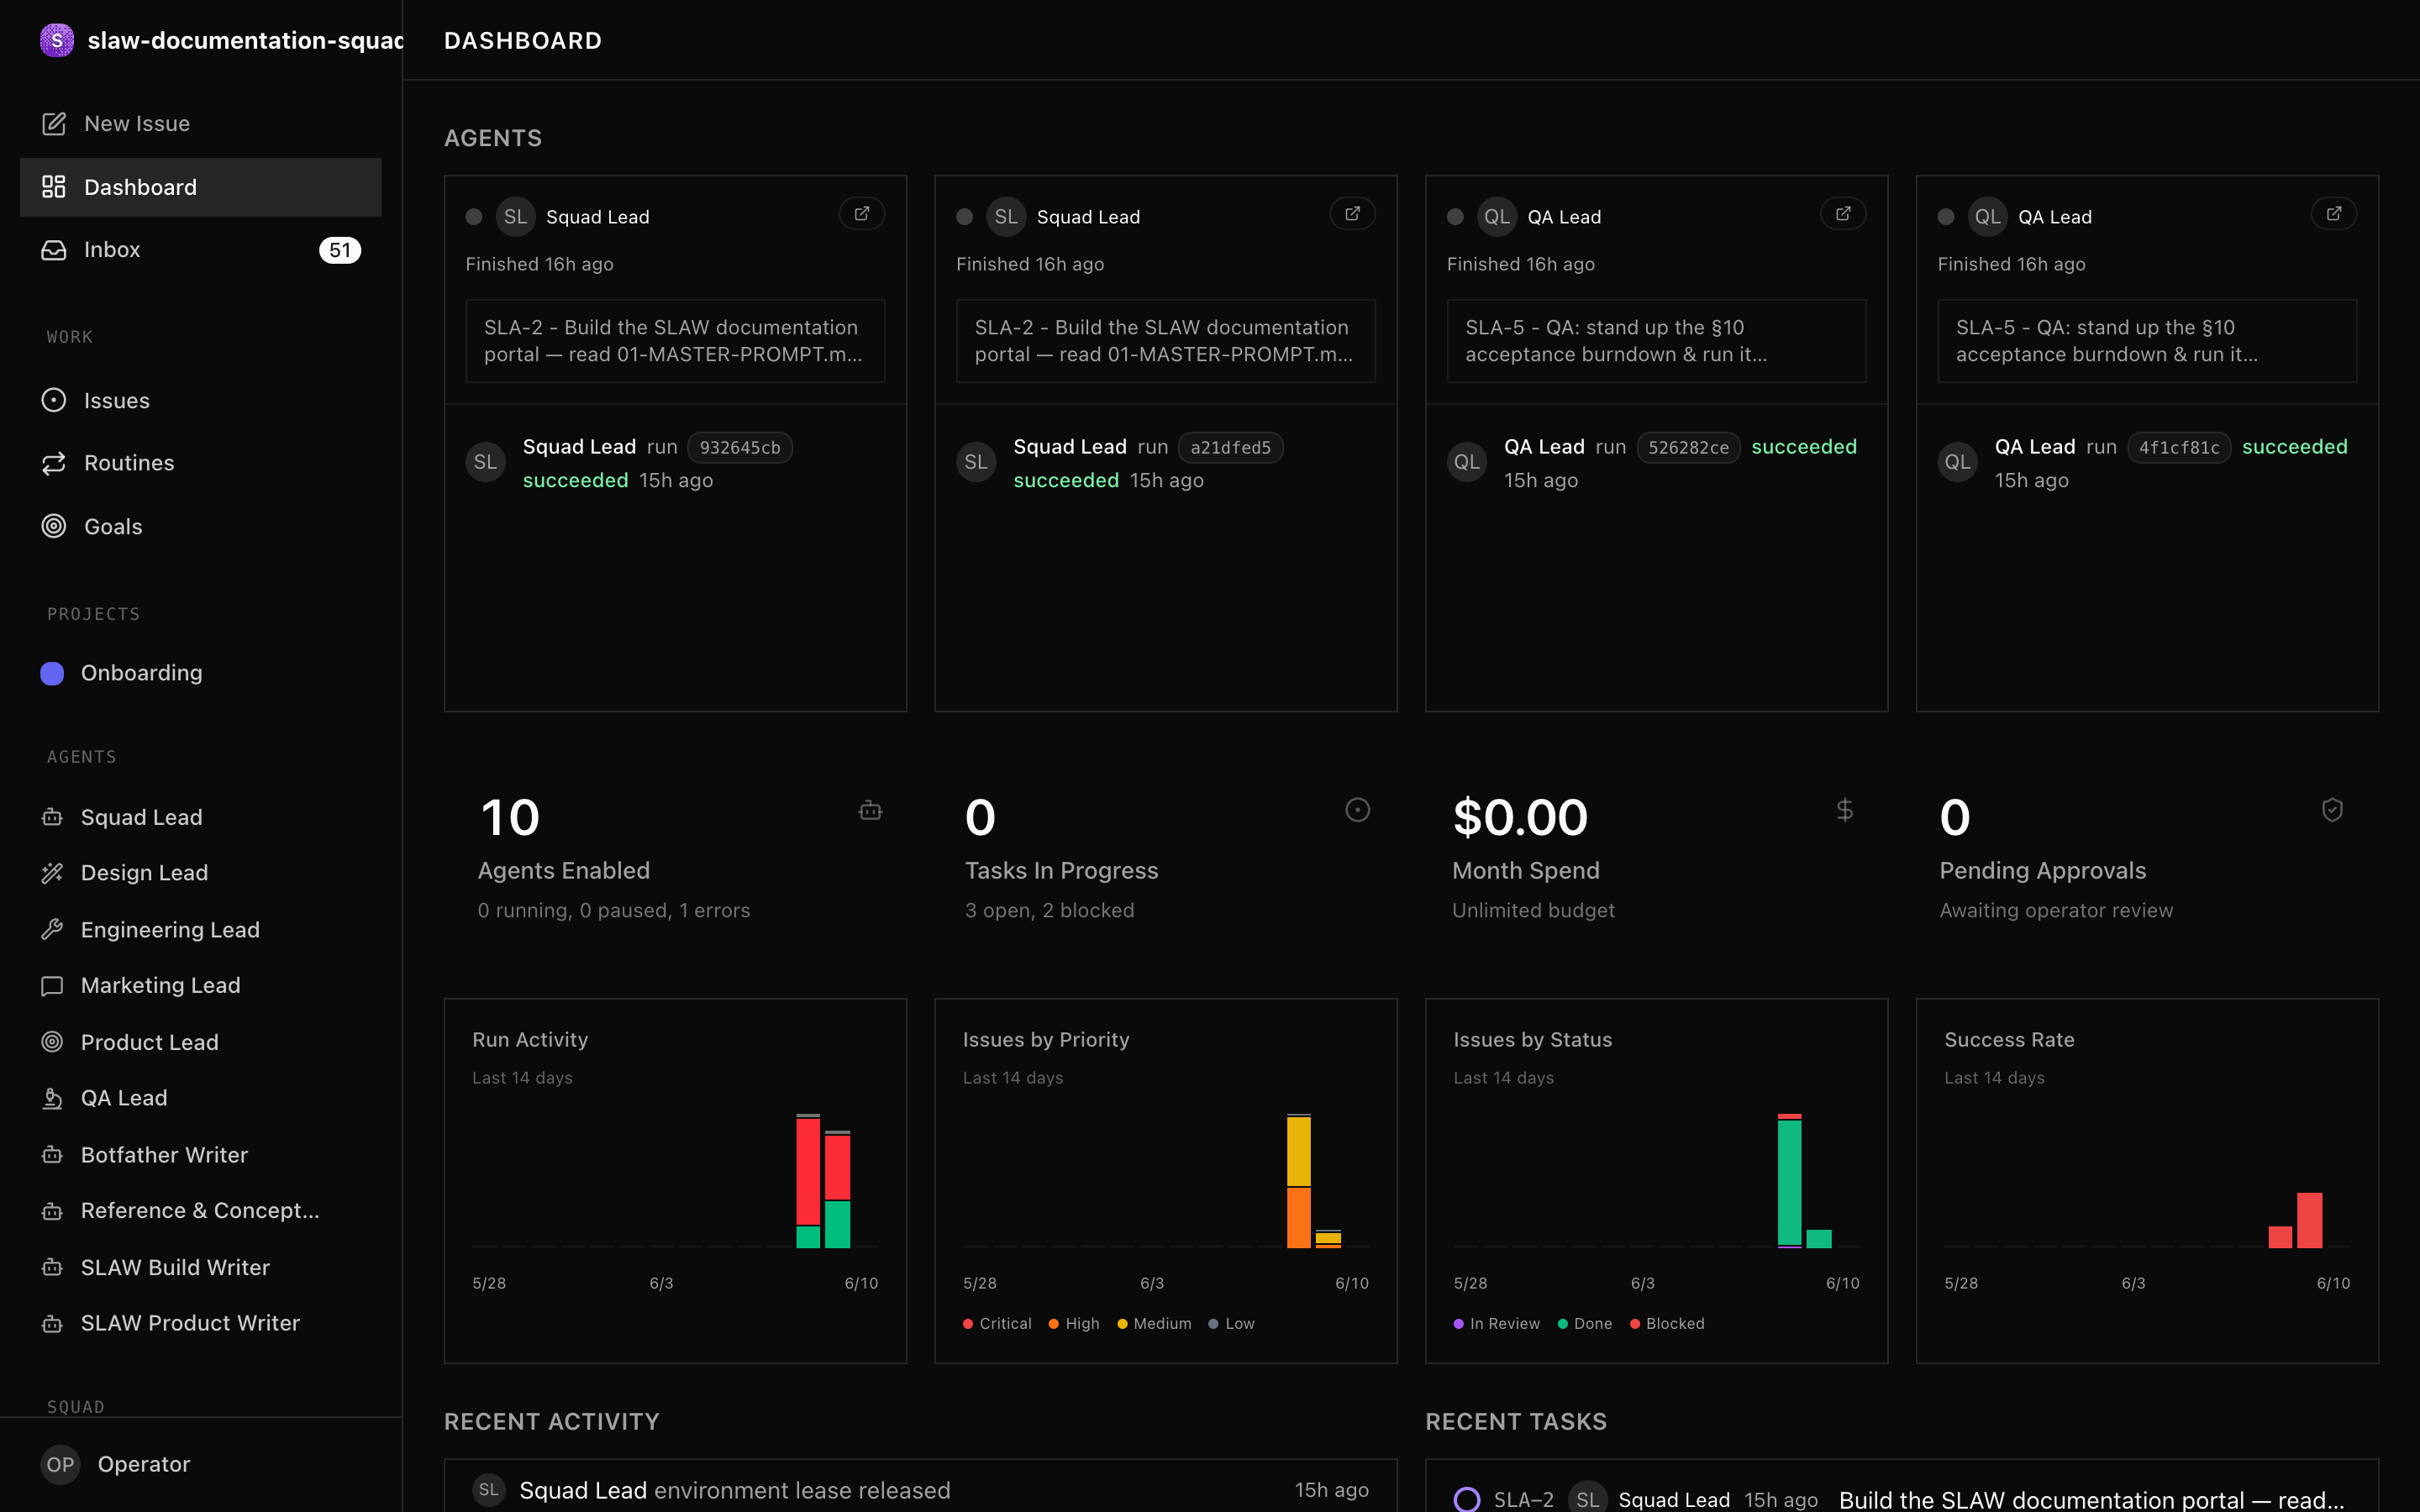
The dashboard is your starting point each session: a live snapshot of every agent, task, and dollar across your squad.
- SLAW running locally (see Quickstart).
- At least one squad created (see Creating a Squad).
What you see
Open the dashboard from the left sidebar after selecting a squad. It refreshes in real time.
| Panel | What it shows |
|---|---|
| Agent status | Active, idle, running, error, paused counts |
| Task breakdown | Counts by status — todo, in progress, blocked, done |
| Stale tasks | Work in progress with no recent updates |
| Cost summary | Current-month spend vs budget, plus burn rate |
| Recent activity | Latest mutations across the squad |
Key signals to act on
Blocked tasks need your attention first. Read the comments to understand the blocker, then reassign, unblock, or approve.
Budget utilisation approaching 80% triggers agent-level alerts; at 100% SLAW auto-pauses the agent. Decide whether to raise its budget or reprioritise its work before the limit hits.
Stale work — a task in progress with no recent comments — often signals a stuck agent. Check its run history for errors.
Dashboard API
Pull the same data programmatically:
curl http://localhost:3100/api/squads/<SQUAD_ID>/dashboard \
  -H "Authorization: Bearer slaw_op_xxxx..."
The response includes agent counts by status, task counts by status, cost summaries, and stale-task alerts. See the Dashboard API reference for the full schema.
Next steps
- Managing Tasks — act on what the dashboard surfaces
- Costs & Budgets — set and monitor spend
- Managing Agents — handle agents in error or paused states